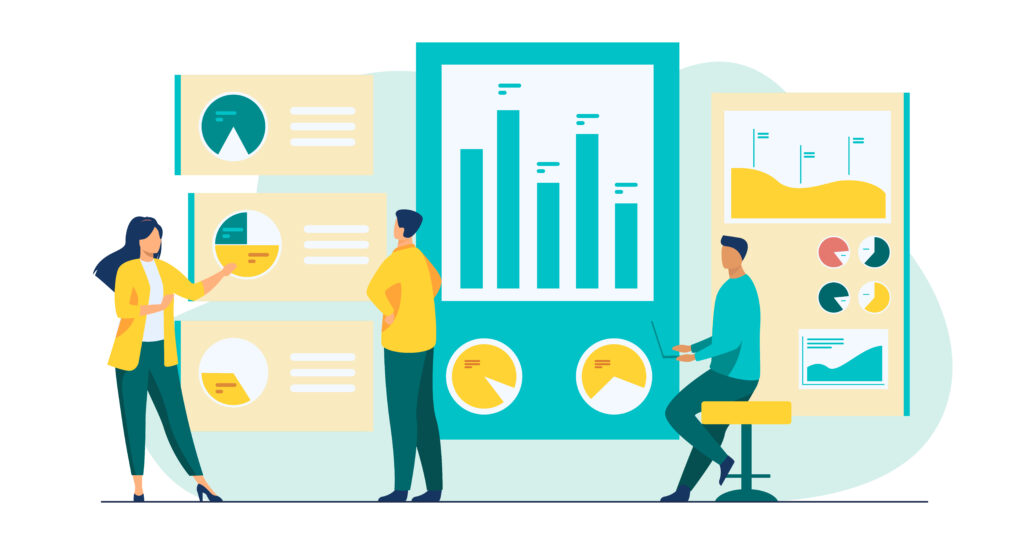
Let’s consider the following scenario: as you’re driving in your car, you glance down and see your speed is 45mph and your fuel tank is half full. This tells you that it is okay to continue driving because you have enough gas and are following the speed limit. What is telling you the speed you are going and how much fuel is left? The gauges on your vehicle’s dashboard tell exactly how the car is performing, everything from speed to fuel. Much like a vehicle’s gauges, B2B marketing dashboards function as a way to see the performance of marketing activities. While dashboards may seem like a simple tool to use, they encompass marketing performance and data, both of which are crucial to marketing and other business teams. In this blog, we explore what a B2B marketing dashboard is, how to use them and a few best practices to incorporate when creating them.
What is a B2B Marketing Dashboard?
Simply put, marketing dashboards are a way to visually display a mass amount of data. This data comes from various marketing activities, including website data, social media engagement and content created. Data can also come from sales, such as total prospects and deals closed and accounting, such as overall revenue generated. Overall, there is a lot of data coming from various sources and a B2B marketing dashboard is the ideal place to store this data and visually present it. Marketing dashboards also allow a benchmark to be established over time. The visual representations of this data show any changes month to month or quarter to quarter and eventually create trend lines. Dashboards are also helpful in analyzing what is working and what is not working which can indicate changes made or optimization of certain efforts.
Why Use B2B Marketing Dashboards?
In short, dashboards prevent you from having to log in to multiple systems all of the time to know how things are going, giving you a high-level oversight of all-things marketing and even sales related. In the fast-paced digital environment, having easy access to key performance data is a must as it is becoming increasingly important to remain agile. While a dashboard does require the time to pull data from each platform or system, that only usually happens at a certain cadence. The minimal time investment for accessible data at all times makes it worthwhile.
B2B marketing dashboards are also a visual queue that will keep you constantly striving for improvement. As mentioned before, the data will translate into trendlines over time, which can inspire your team to reach higher marks and set goals. Dashboards are also easy to share among different departments as it is usually one slide of a presentation or one file in Excel. When your team – whether it’s an internal marketing team or your entire business – knows how your efforts are performing, everyone can work to support a successful marketing program.
How to Utilize Dashboards Effectively
Meeting with key stakeholders, evaluating benchmarks and milestones in your marketing plan and understanding what is important when marketing your company will help you decide which efforts support your objectives and ultimately determine what to focus on in dashboard creation. It can be easy to go overboard when creating a dashboard. While data is incredibly important, sometimes too much of it can cause the dashboard to be too busy. Narrow down what data matters the most for those that need to understand performance and trends.
How to Use Dashboards
Determining which dashboards are important to your program is as important as setting them up – a pretty panel isn’t necessarily a good panel. Meeting with key stakeholders, evaluating benchmarks and milestones in your marketing plan and understanding what is important when marketing your company will help you decide which efforts support your objectives and allow you to focus on which dashboards to follow and maintain.
When used correctly, dashboards can be a fun and visual way to show how your efforts and activities are performing. With ways to manipulate data to turn into graphs, charts and more and highlight recent performance wins, a B2B marketing dashboard acts as the one source of truth and should be something all team members have access to.
Here are a few best practices we recommend following:
- Update on a consistent cadence. Whether it be the beginning of the month, end of the month, or every quarter, choose a time frame to update the dashboard that makes sense for your team in understanding performance.
- Separate into sections. Many marketing activities take place, so separate your dashboard into different sections. Dedicate one portion to the website, one to content and so on. This can help keep you organized and direct attention to those looking at it.
- Color code where appropriate. Adding color to charts and graphs can help show clear distinctions in data. Ensure there is consistency with colors across the dashboard to avoid confusion.
- Ensure charts auto-populate. If using Excel or a similar program, ensure that when you input data into a table, the chart associated with it automatically populates. This saves a lot of time and stress of doing the same work twice.
Ready to organize your B2B marketing activities and take your performance to the next level? Contact us today or request a free marketing consultation. We have helped countless clients elevate their B2B marketing and create a dashboard to show for it.
There are no comments